UNIFORM Consultant – Update
We’re excited to see more and more consultants using our consultant version. The total number of users has gone up to almost 1700 registered users and the cloud database contains already more than 12 million animals.
UNIFORM Consultant is a comprehensive solution for advisors in the dairy industry, allowing for simultaneous monitoring of data from multiple farms via a cloud-based system. As a fully realized herd management platform, it offers daily access to farm data, equipping you with robust analysis tools to provide exceptional advice to your clients.
Highlights of the latest releases in 2025
Find the full list of new features within the platform at the [?] -> tab [Updates]
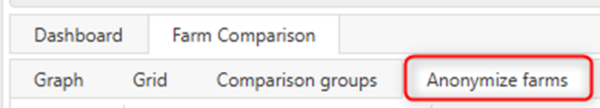
New in Farm Comparison: anonymize farms
In the “Farm Comparison” tab of the Consultant Dashboard, a new feature has been added that allows farms to have an alias. This means you can show farm comparison data to individual farmers without revealing the names of other farms, keeping their identities private.
New Animal Record slider
Sometimes it’s useful to see extra information of an animal when looking at a certain topic on the animal record. On multiple tabs of the Animal Record, a NEW customizable slider is now added to show important animal info. This will prevent having to switch between different tabs on the Animal Record. The information presented in the slider is customizable by the wheel in the right top corner of the slider.
Customizable slider – Animal Record
New Milking Times analysis [2.12]
To analyze the milking times and procedures in dairy parlors withing a graphical overview in the software. This overview is only available for parlors and the availability of data depends on the brand and version of the parlor.
New fertility KPI’s in [3.1] Fertility report
The following KPI’s have been added to the report:
Graph of feed intake on the dashboard
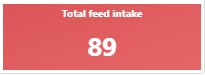
A new graph of the feed intake can be added to the dashboard, the blue line represents the feed allocation and the green line the feed intake. Within this graph it is possible to use filter options for groups and feed types. Additionally, a button for the total (concentrate) feed intake has been added as an available KPI in the KPI’ buttons.
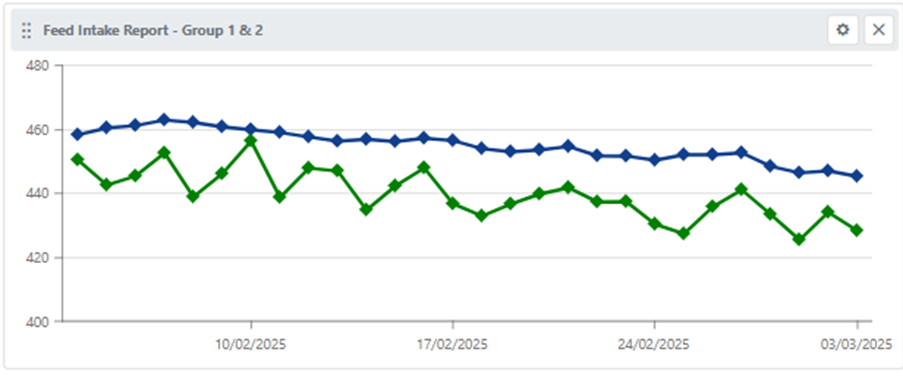
Feed intake report
For more information about UNIFORM Consultant go to our ‘For consultants’ page. contact us or fill in the form for a free web demo / trial.